1. linear function graphs (y = k x)
일차함수
linear function
"함수그래프는 상위수학으로의 관문"
" understanding function graphs
is a big step
towards
advanced level math "
is a big step
towards
advanced level math "
일차함수의 그래프는, 일차 비례식을 좌표평면에 나타내는 가장 기초적인 내용부터, 중학과정에서는 포물선과 직선 그리고 고등과정에서는 다항함수의 곡선과 직선의 관계까지 다양하게 응용되는 단원입니다.
문과 고등학생 중에는 직선의 그래프도 제대로 못 그려서 쩔쩔매는 모습을 자주 봅니다. 수학실력의 차이는, 함수와 그래프에서 비롯된다고 할 정도로 중요하니, 기초부터 확실하게 다져 두기 바랍니다.
오늘은 간단한 비례식의 직선부터, 쉽고 빠르게 그래프를 그릴 수 있는 방법을 설명할 예정이니, 철저히 숙달시켜 두어야 합니다.
다시 강조하지만, 문과라 하더라도, 고등과정의 다항함수의 미적분까지 중고등 수학 전반에서 활용되는 매우 중요한 개념입니다.
♧ ♧ ♧ ♧ ♧ ♧
스마트폰에서 수학 수식을 보시려면, 왼쪽 버튼을 누른 후
[데스크톱 보기] 를 설정하세요.
You can read math equations
by selecting [desktop view] on the mobile.
♧ ♧ ♧ ♧ ♧ ♧
일반적으로 y 가 x 의 값에 정비례한다고 하면, y 는 x 의 실수배가 되니까, 식으로는 y = k x 라고 표현합니다.
When y is increasing at the same rate, as x increases, we say y is directly proportional to x
and denote y = k x.
그러면, k 가 1 일 때, 즉, y = x 의 그래프는 어떻게 그릴까요? x 값에 따라 정해지는, y 값들의 일부만 표로 나타내 볼까요?
Then, how can we sketch the graph of y = k x ? In case k = 1, let's see the table of ordered pairs (x, y) that satisfy the equation y = x as shown below.
x
|
–3
|
–2
|
–1
|
0
|
1
|
2
|
3
|
y
|
–3
|
–2
|
–1
|
0
|
1
|
2
|
3
|
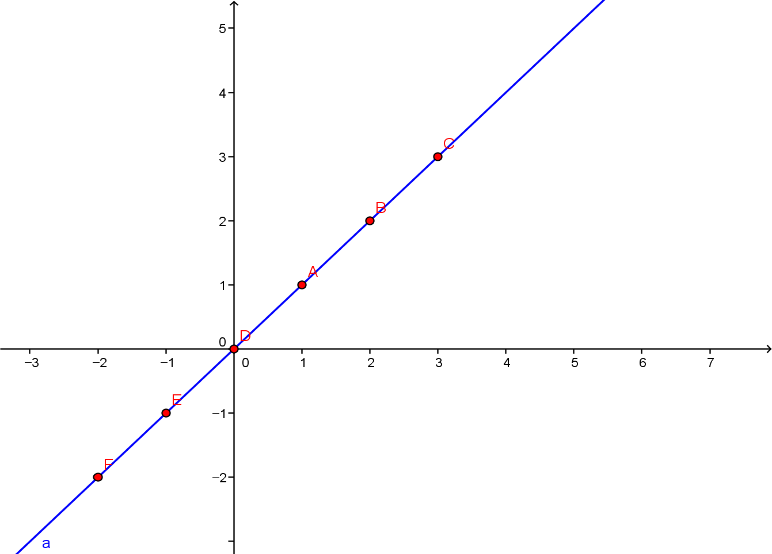
이 표의 값들은 그래프로 나타낸다면, 좌표평면에 찍히는 점 (x, y) 의 좌표들이니까, … (–3, –3), (–2, –2), … , (3, 3) … 들을 포함하는 무수히 많은 빨간점들의 집합, 즉 아래 그림에서 파란색 직선이 되겠지요?
If we plot
these infinite solution pairs on the coordinate plane, it will represent a blue
straight line as follows :
이 식에서 k 를 일반화해서 좌표평면에 나타내면, 어떻게 나타날까요? 즉 k 가 1 일 때, 2 일 때, 3 일 때 … 등을 그래프로 그려 볼까요?
What if the value k changes? Let's sketch the graphs of y = k x, when k = 1, 2, 3 ... all together, on the graph below :

위 그림에서, k 가 1 일 때는 기울기가 45° 인 파란색 직선이고, k 값이 점점 커질 수록 y 축에 가까이 붙는 모양이지요? 따라서, 이 k 값을 기울기라고 합니다.
If k = 1,
the slope of blue line is 45°, as shown on the plane graph above. When k becomes
larger, this straight line gets closer to y-axis. Accordingly, k is
called the 'slope' (AmE) or the 'gradient' (BrE) of a line.
예컨데, k = 3 이라면, k = 3 = \(\frac{{{\rm{ }} + 3{\rm{ }}}}{{ + 1}}\) 이라고, 분모를 자연수(+)로 하는 기약분수로 고친 다음, [(분모인) 오른쪽으로 1칸] 움직일 때, [(분자인) 위로 3칸] 간다고 해석합니다.
In order to interpret the slope k, we need to change the value into fraction with positive integer denominator. For example, when k = 3 = \(\frac{{{\rm{ }} + 3{\rm{ }}}}{{ + 1}}\), we interpret it as 'rise 3 over run 1', which means 'move 1 unit to the right and 3 units up'.
또, 기울기 k = \(\frac{{{\rm{ }} 5{\rm{ }}}}{{ 3}}\)라면, \(\frac{{{\rm{ }} + 5{\rm{ }}}}{{ + 3}}\)라고 해석한 다음, [오른쪽으로 3칸] 움직일 때, [위로 5칸] 간다고 하면 되겠지요?
If k = \(\frac{{{\rm{ }} 5{\rm{ }}}}{{ 3}}\), transform into \(\frac{{{\rm{ }} + 5{\rm{ }}}}{{ + 3}}\) and interpret it as 'rise 5 over run 3', which means 'move 3 units to the right and 5 units up'.
만일, 음수(–) 인 k = \( - \frac{{{\rm{ }}2{\rm{ }}}}{3}\) 라면, 어떻게 해석해야 할까요?
When the slope k has negative value, for example k = \( - \frac{{{\rm{ }}2{\rm{ }}}}{3}\), how can we draw this line?

k = \(\frac{{{\rm{ }} - 2{\rm{ }}}}{{ + 3}}\)
Just change the value into fraction with positive integer denominator such as \(\frac{{{\rm{ }} - 2{\rm{ }}}}{{ + 3}}\) and interpret as 'rise –2 over 3', which means 'move 3 units to the right and 2 units down'.
분모를 자연수(+)로 하는 기약분수로 고치는 이유는, 왼쪽이 아니라 오른쪽을 표준으로 하기 위함입니다.
직선의 그래프에 완전히 익숙해 지기전까지는, 항상 [(분모인) 오른쪽으로 몇 칸] 움직일 때, [(분자인) 위 또는 아래로 몇 칸] 간다고 해석해서 그리기를 강력하게 추천합니다.
It is strongly recommended to make positive denominator and interpret 'when we move _ units to the right, ⋯ ', if you are beginning or mid-level learner.
Just change the value into fraction with positive integer denominator such as \(\frac{{{\rm{ }} - 2{\rm{ }}}}{{ + 3}}\) and interpret as 'rise –2 over 3', which means 'move 3 units to the right and 2 units down'.
분모를 자연수(+)로 하는 기약분수로 고치는 이유는, 왼쪽이 아니라 오른쪽을 표준으로 하기 위함입니다.
직선의 그래프에 완전히 익숙해 지기전까지는, 항상 [(분모인) 오른쪽으로 몇 칸] 움직일 때, [(분자인) 위 또는 아래로 몇 칸] 간다고 해석해서 그리기를 강력하게 추천합니다.
It is strongly recommended to make positive denominator and interpret 'when we move _ units to the right, ⋯ ', if you are beginning or mid-level learner.
만일, k = 0 이라면?
k = \(\frac{{{\rm{ }} 0{\rm{ }}}}{{ 0이 아닌 숫자}}\)이라고 바꾸어서 해석하면, [오른쪽으로 몇 칸] 움직일 때, [0 칸]이 되니까, 위 그림에서 빨간색 직선 즉, x 축이 됩니다.
If k = 0, then simply interpret '0 rise over run', which means the slope is horizontal and the line graph will be red colored x-axis as shown above.
이제, 배운 것을 정리해 볼까요?
Now, let's summarize what we have learned as follows :
Graph of y = k x is a straight line that passes through the origin (0, 0) and when we move to the right,
(1) k > 0 이면 오른쪽 위로 증가
moves upwards (increasing)
(2) k < 0 이면 오른쪽 아래로 감소
moves downwards (decreasing)
(3) k = 0 이면 x 축을 나타낸다.
it will be x-axis
또, k 값이 음수(–) 이건, 양수(+) 이건 그 절대값이 크면 클수록 y 축에 가까이 달라 붙고, 그 값이 0 에 가까워지면 x 축에 점점 달라 붙는다.
This straight line of y = k x is getting closer to y-axis if the absolute value | k | gets larger. On the other hand, the line graph gets closer to x-axis if the absolute value | k | is getting smaller to 0.
Comments
Post a Comment